NYC Democratic Mayoral Primary 2025 Following the surprising upset in the NYC Democratic mayoral primary in in June, I wanted to explore the voting data....
Candidential Tweets Update: I built an app in the summer of 2015 to explore tweets of presidential candidates. It provided realtime text analysis of...
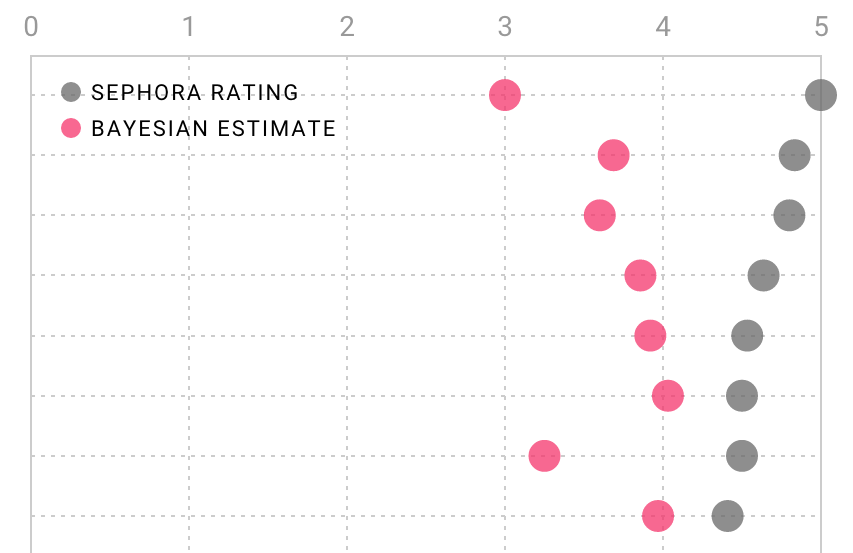
Sephora Product Ranking with Bayesian Estimation Like many people, I rely on the reviews of others to find the best products on any website. This is...
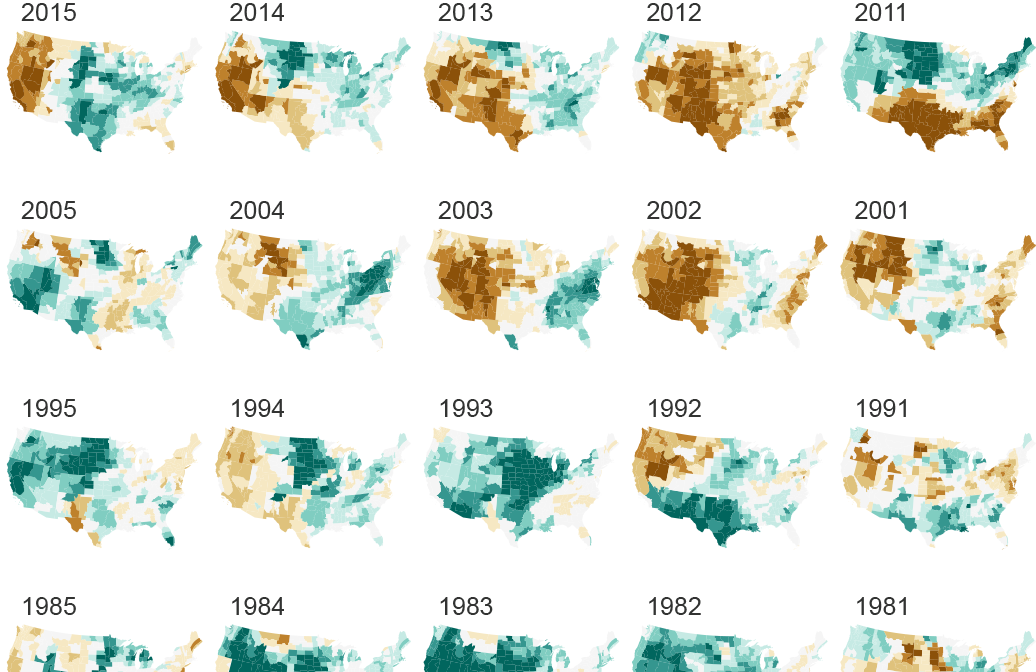
Tiny Drought Maps Using the Palmer Drought Severity Index, a measure of dryness / wetness, I mapped the yearly average drought level in different...
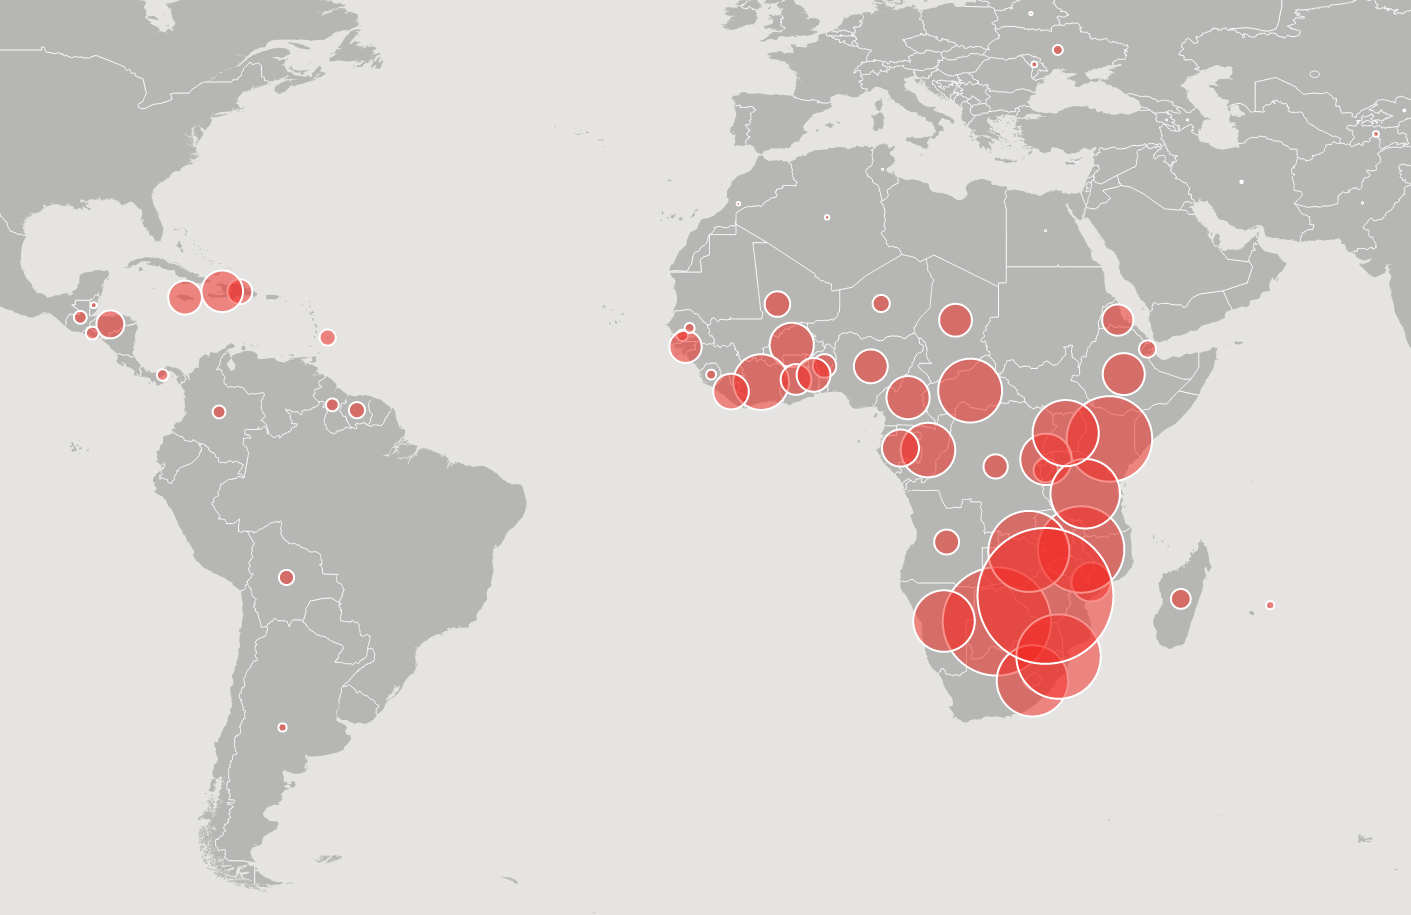
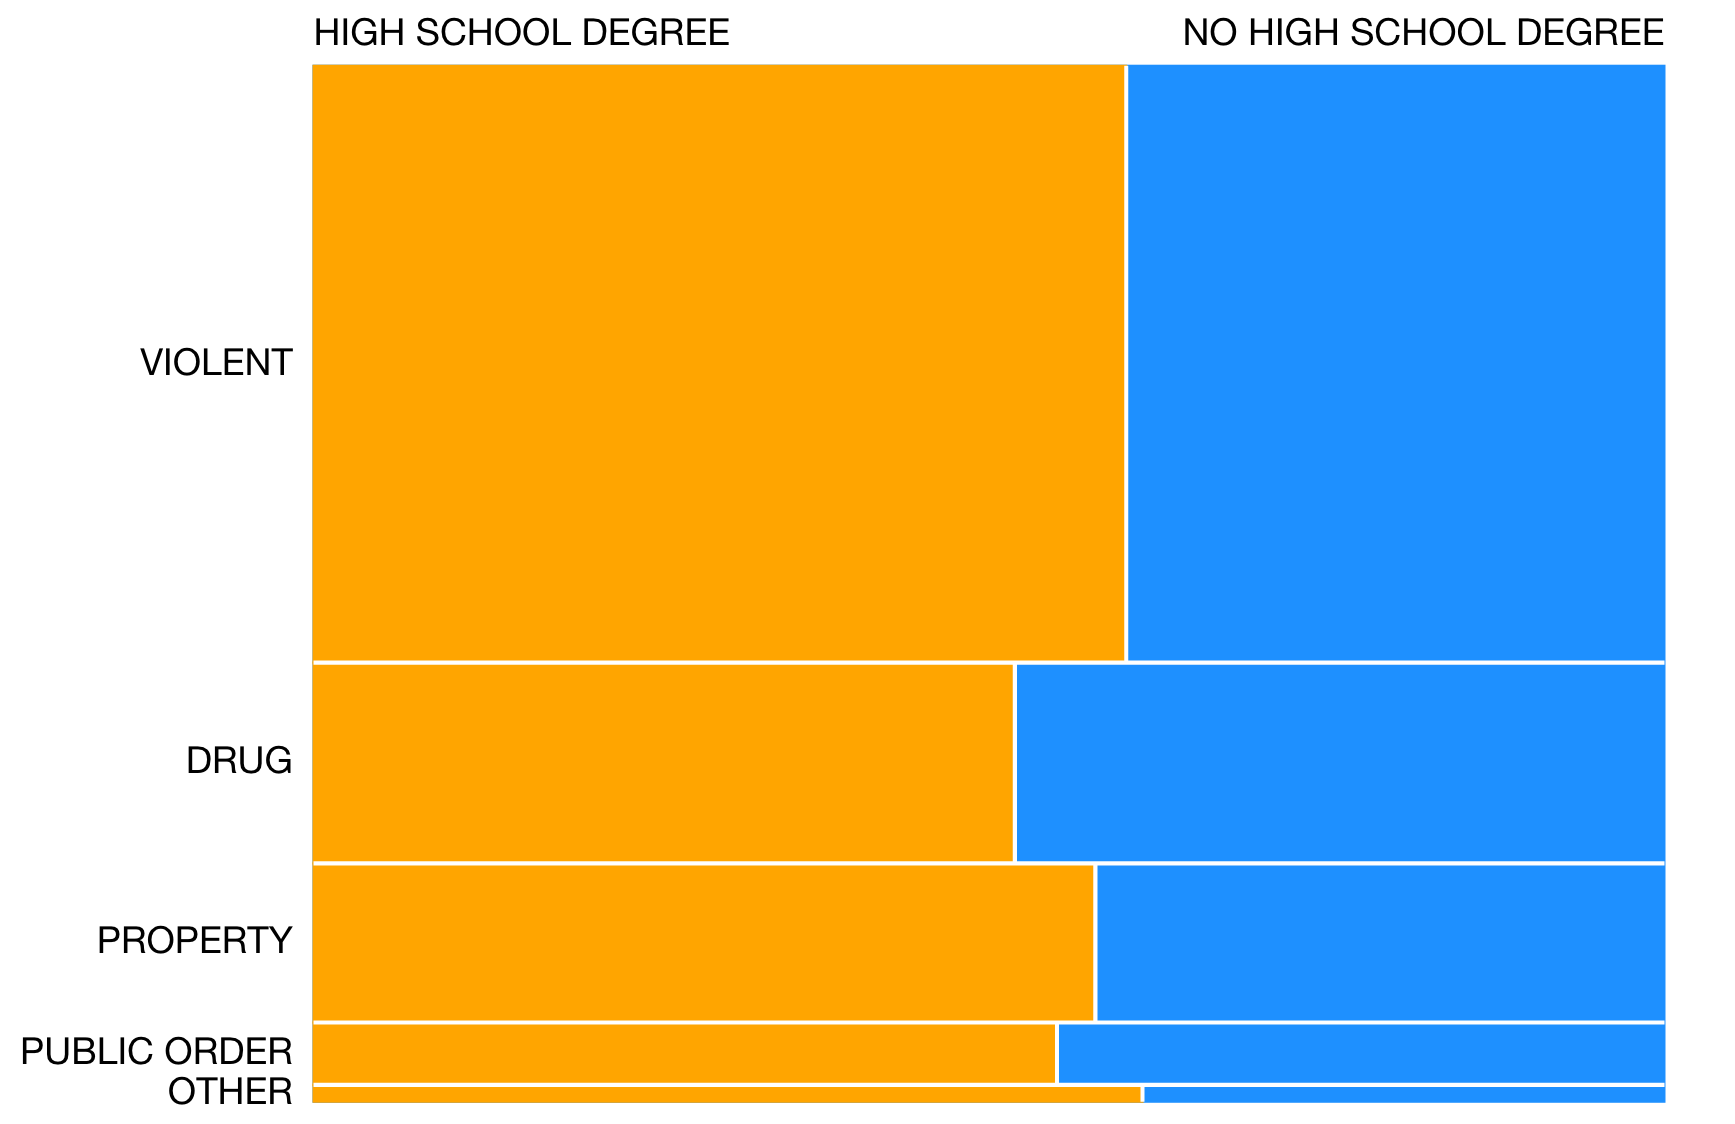
Investigating the Prison Population As of 2012, there were almost 1.5 million inmates in state and federal correctional facilities. If you include the number...
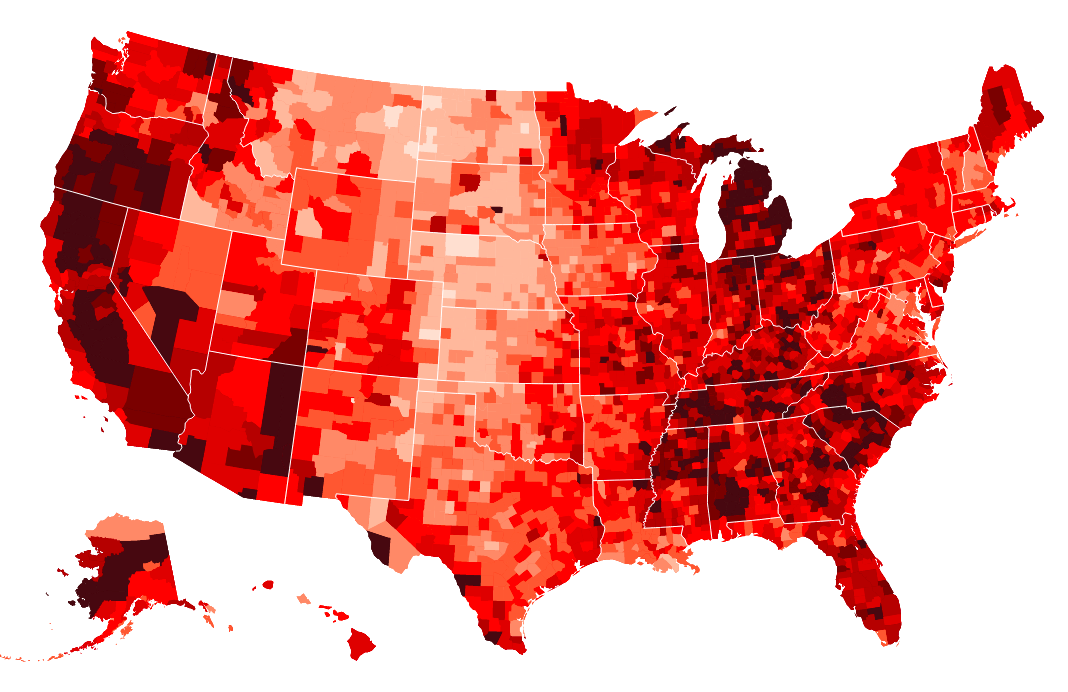
Unemployment During the 2008 Recession Annual Average by County, 2007 to 2013 Source: Bureau of Labor Statistics
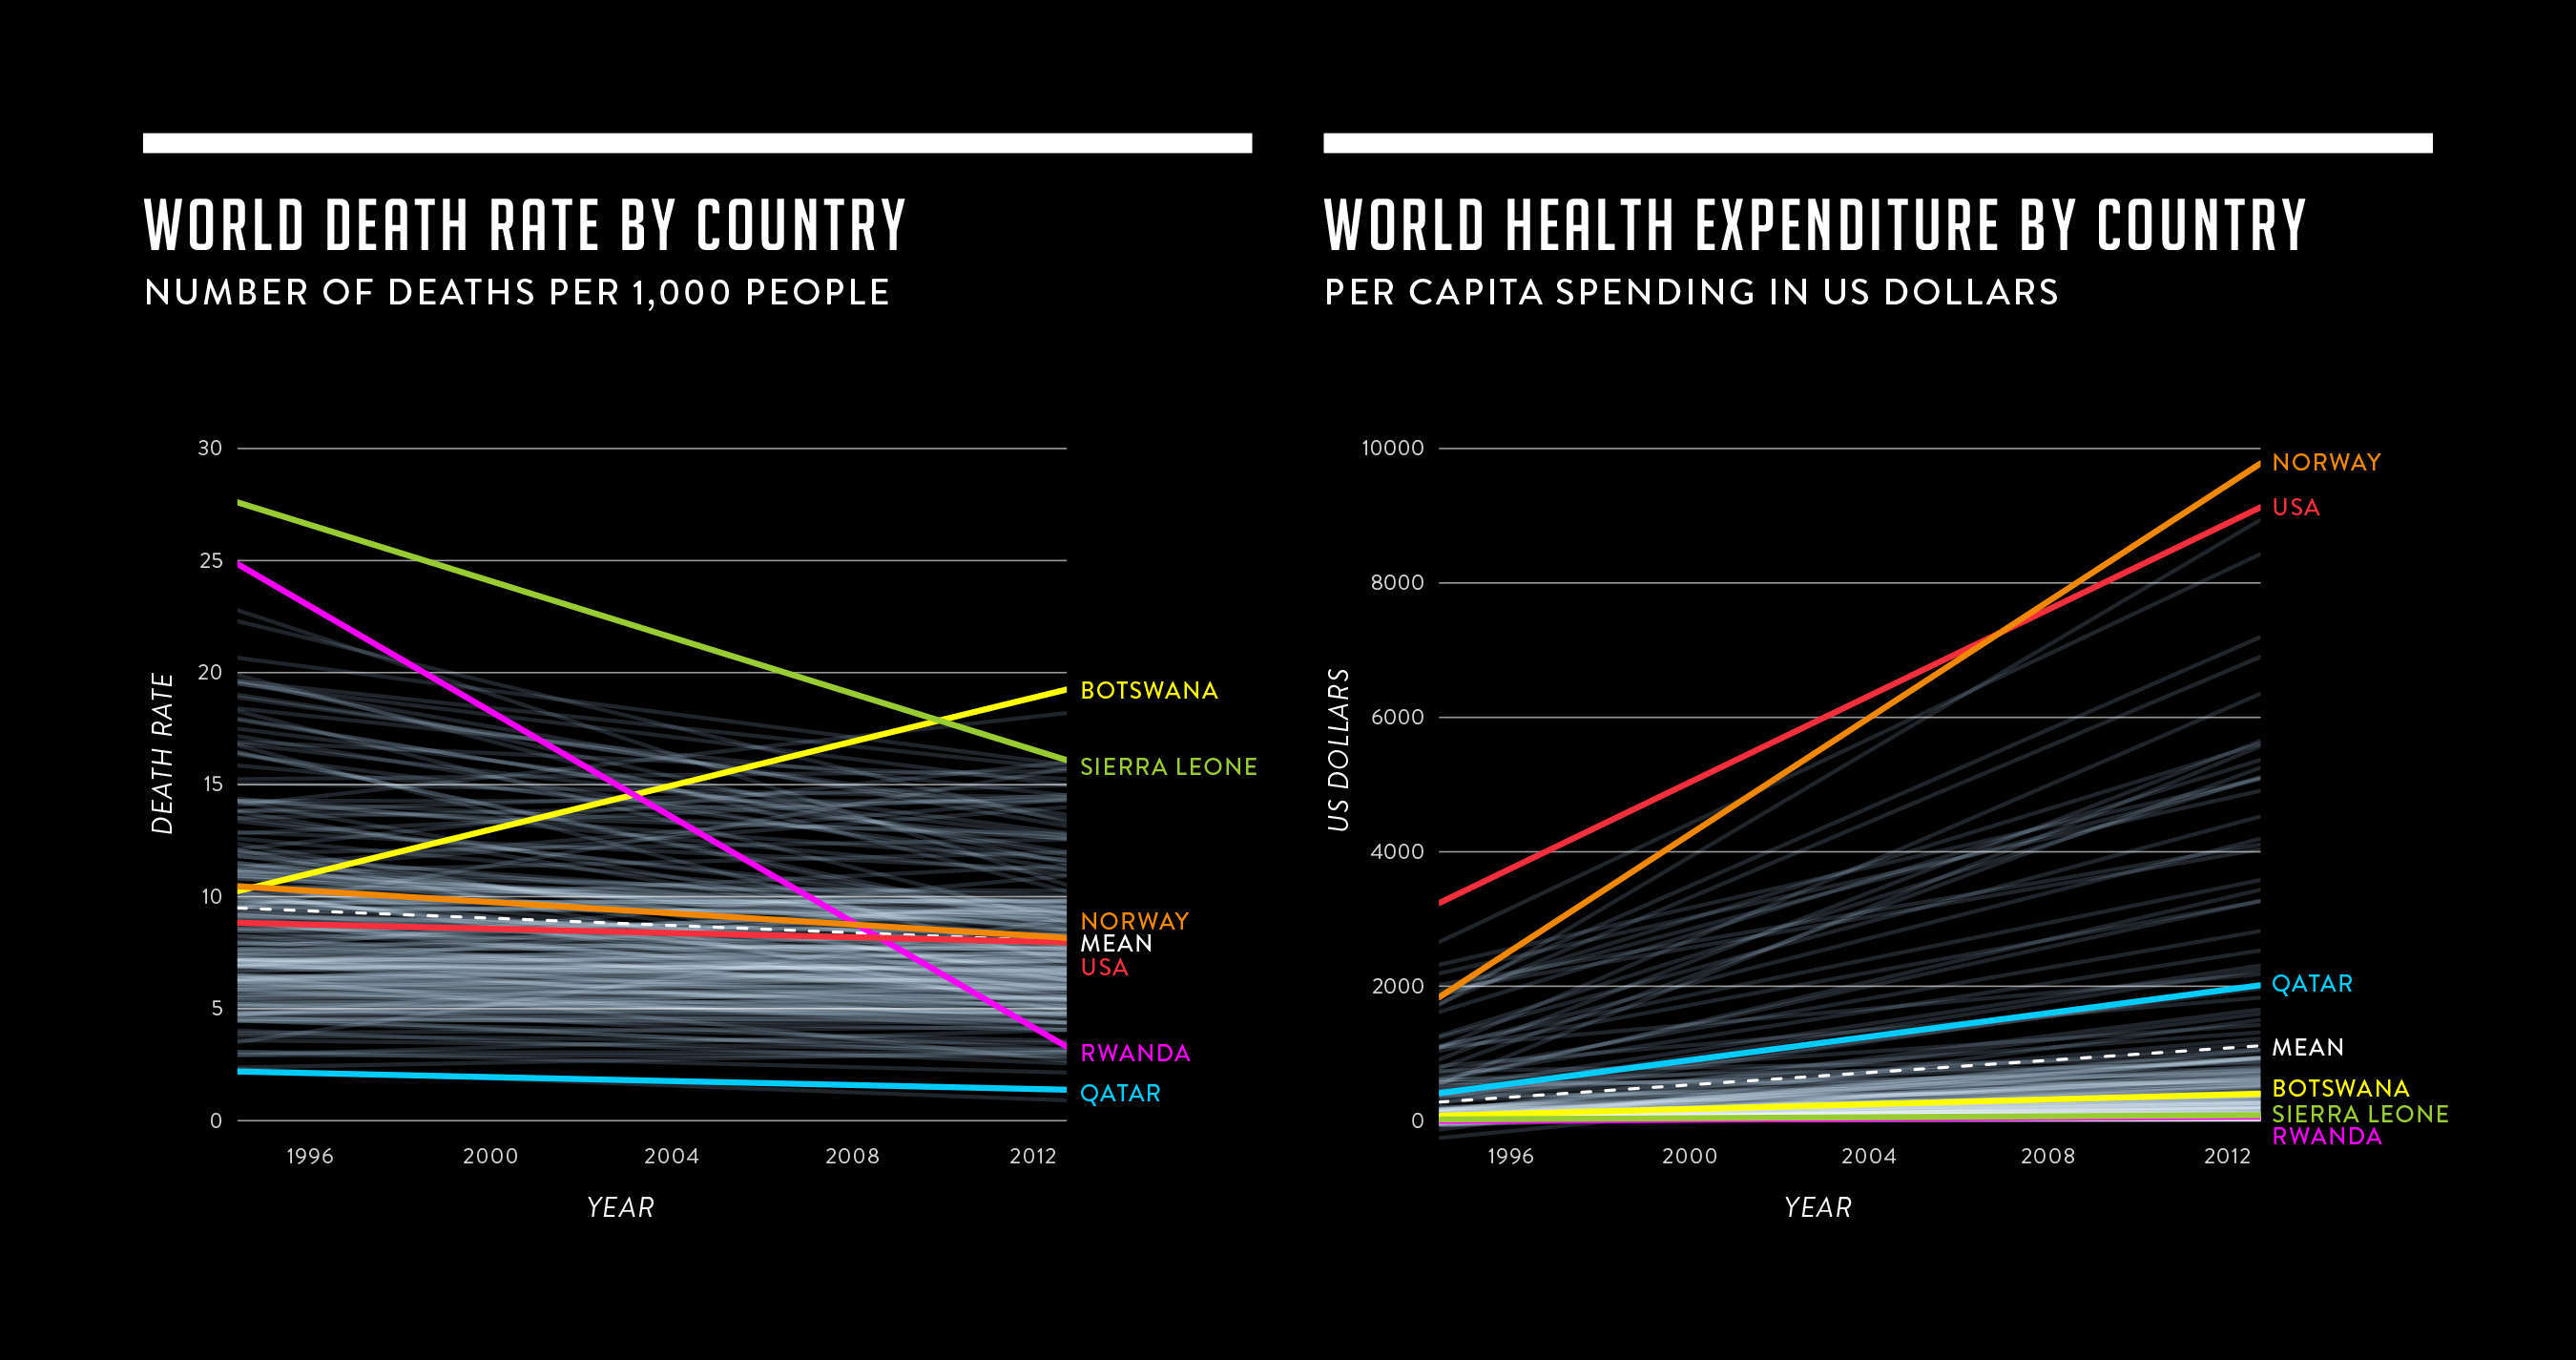
Death Rates vs Health Spending Below is a project I completed for a course called Statistical Foundations of Data Visualization at NYU. Scroll down to...
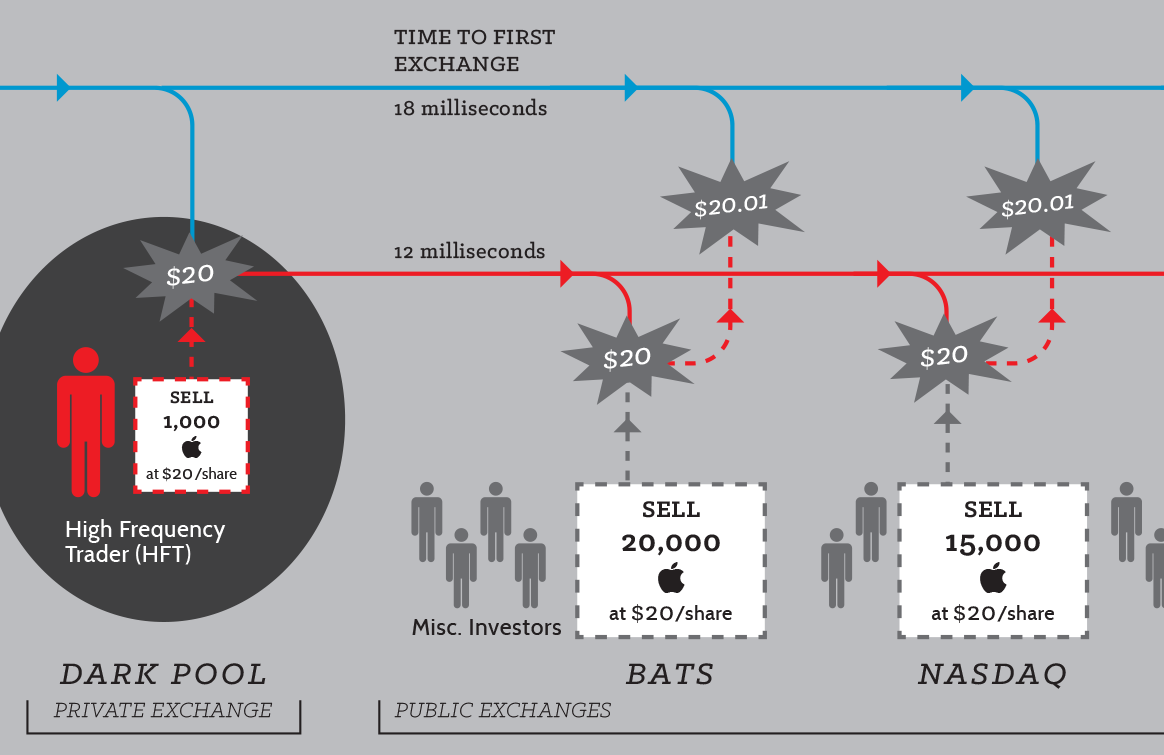
High Frequency Trading After reading Flash Boys: A Wall Street Revolt by Michael Lewis, I created this graphic illustrating the process of high frequency...
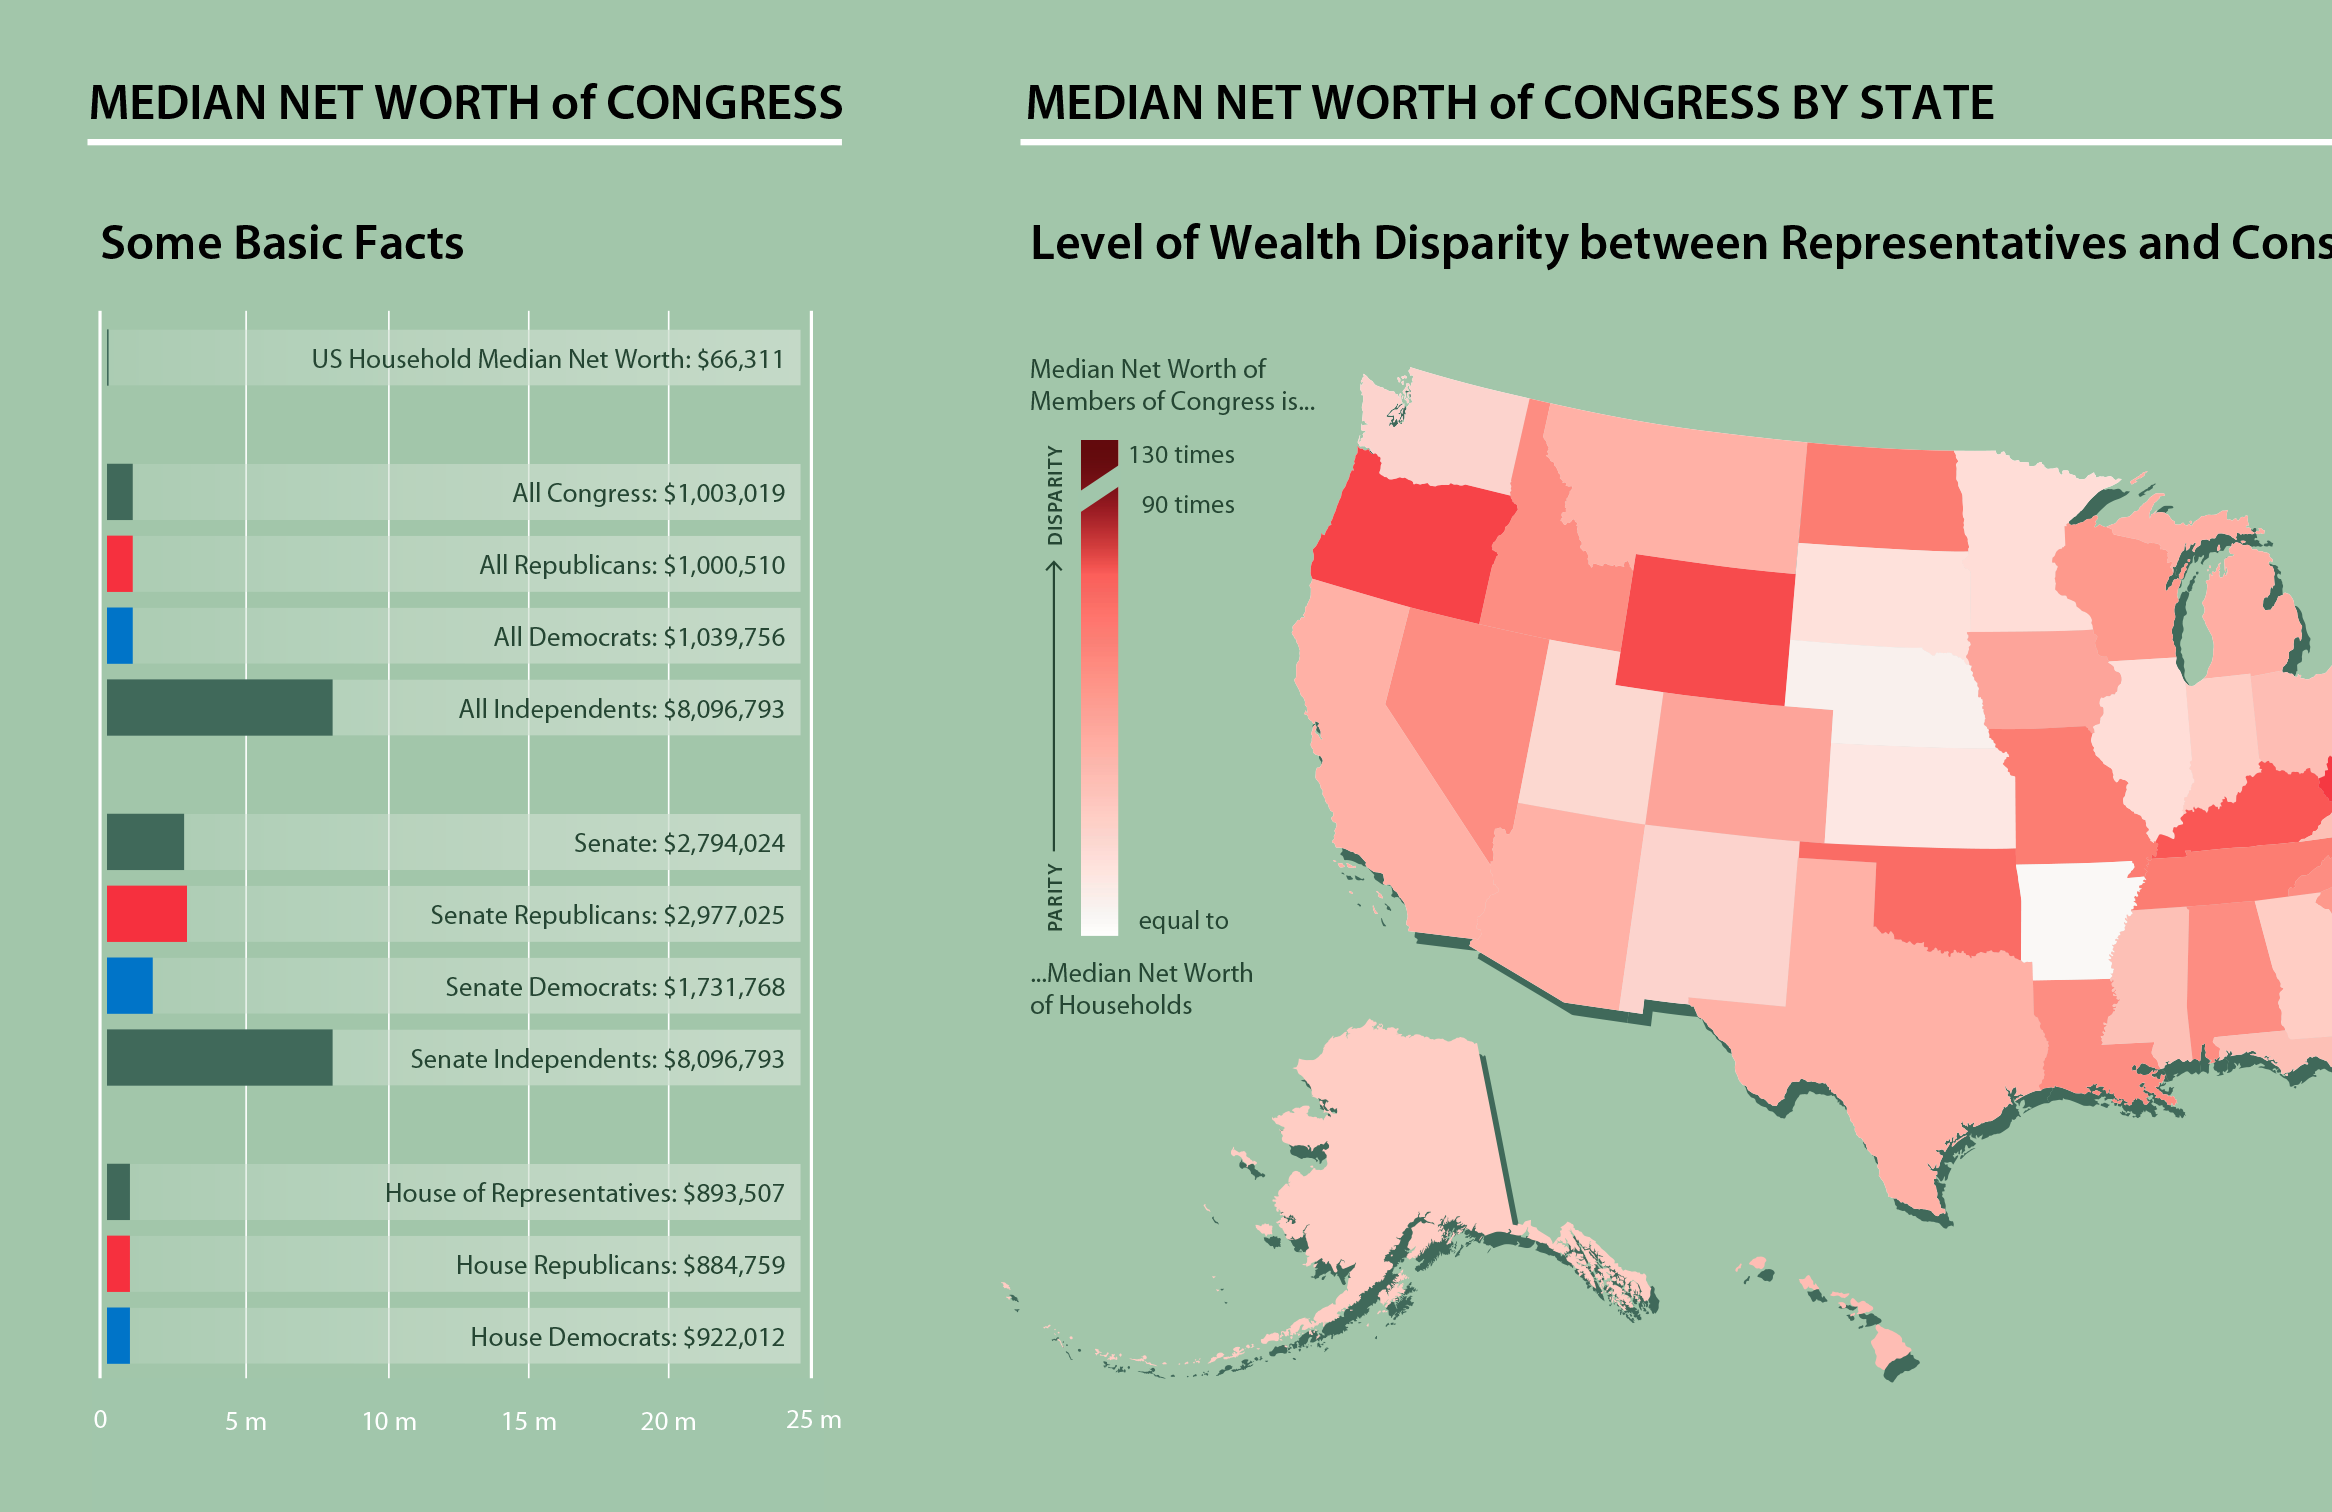
Congress Below is a project I completed for a course in Information Design at The School of Visual Arts in 2014....
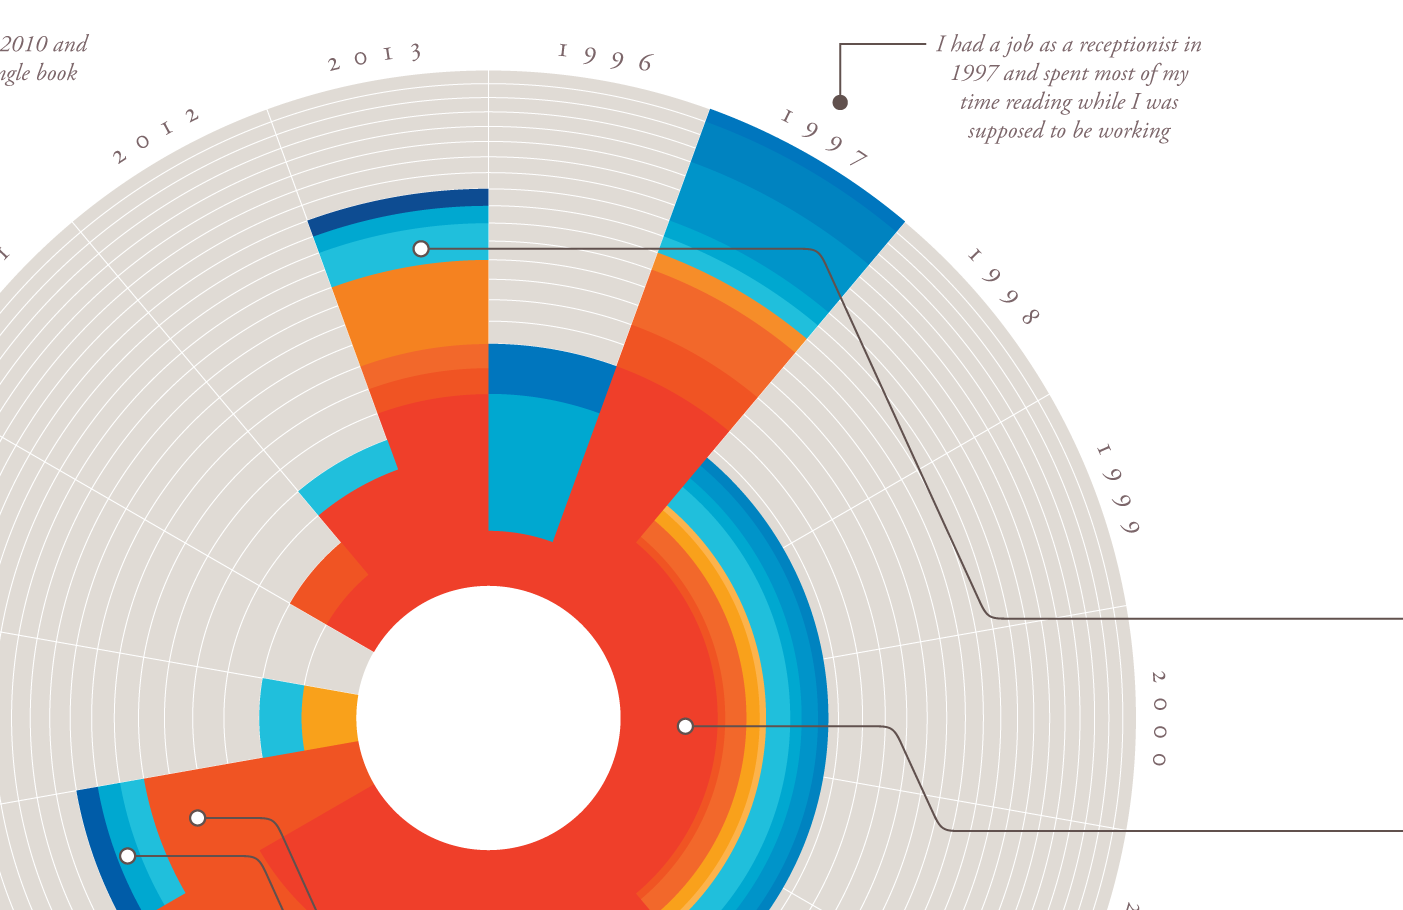
Books I’ve been gathering data on myself for over 18 years, writing down all the books I read as I finish...
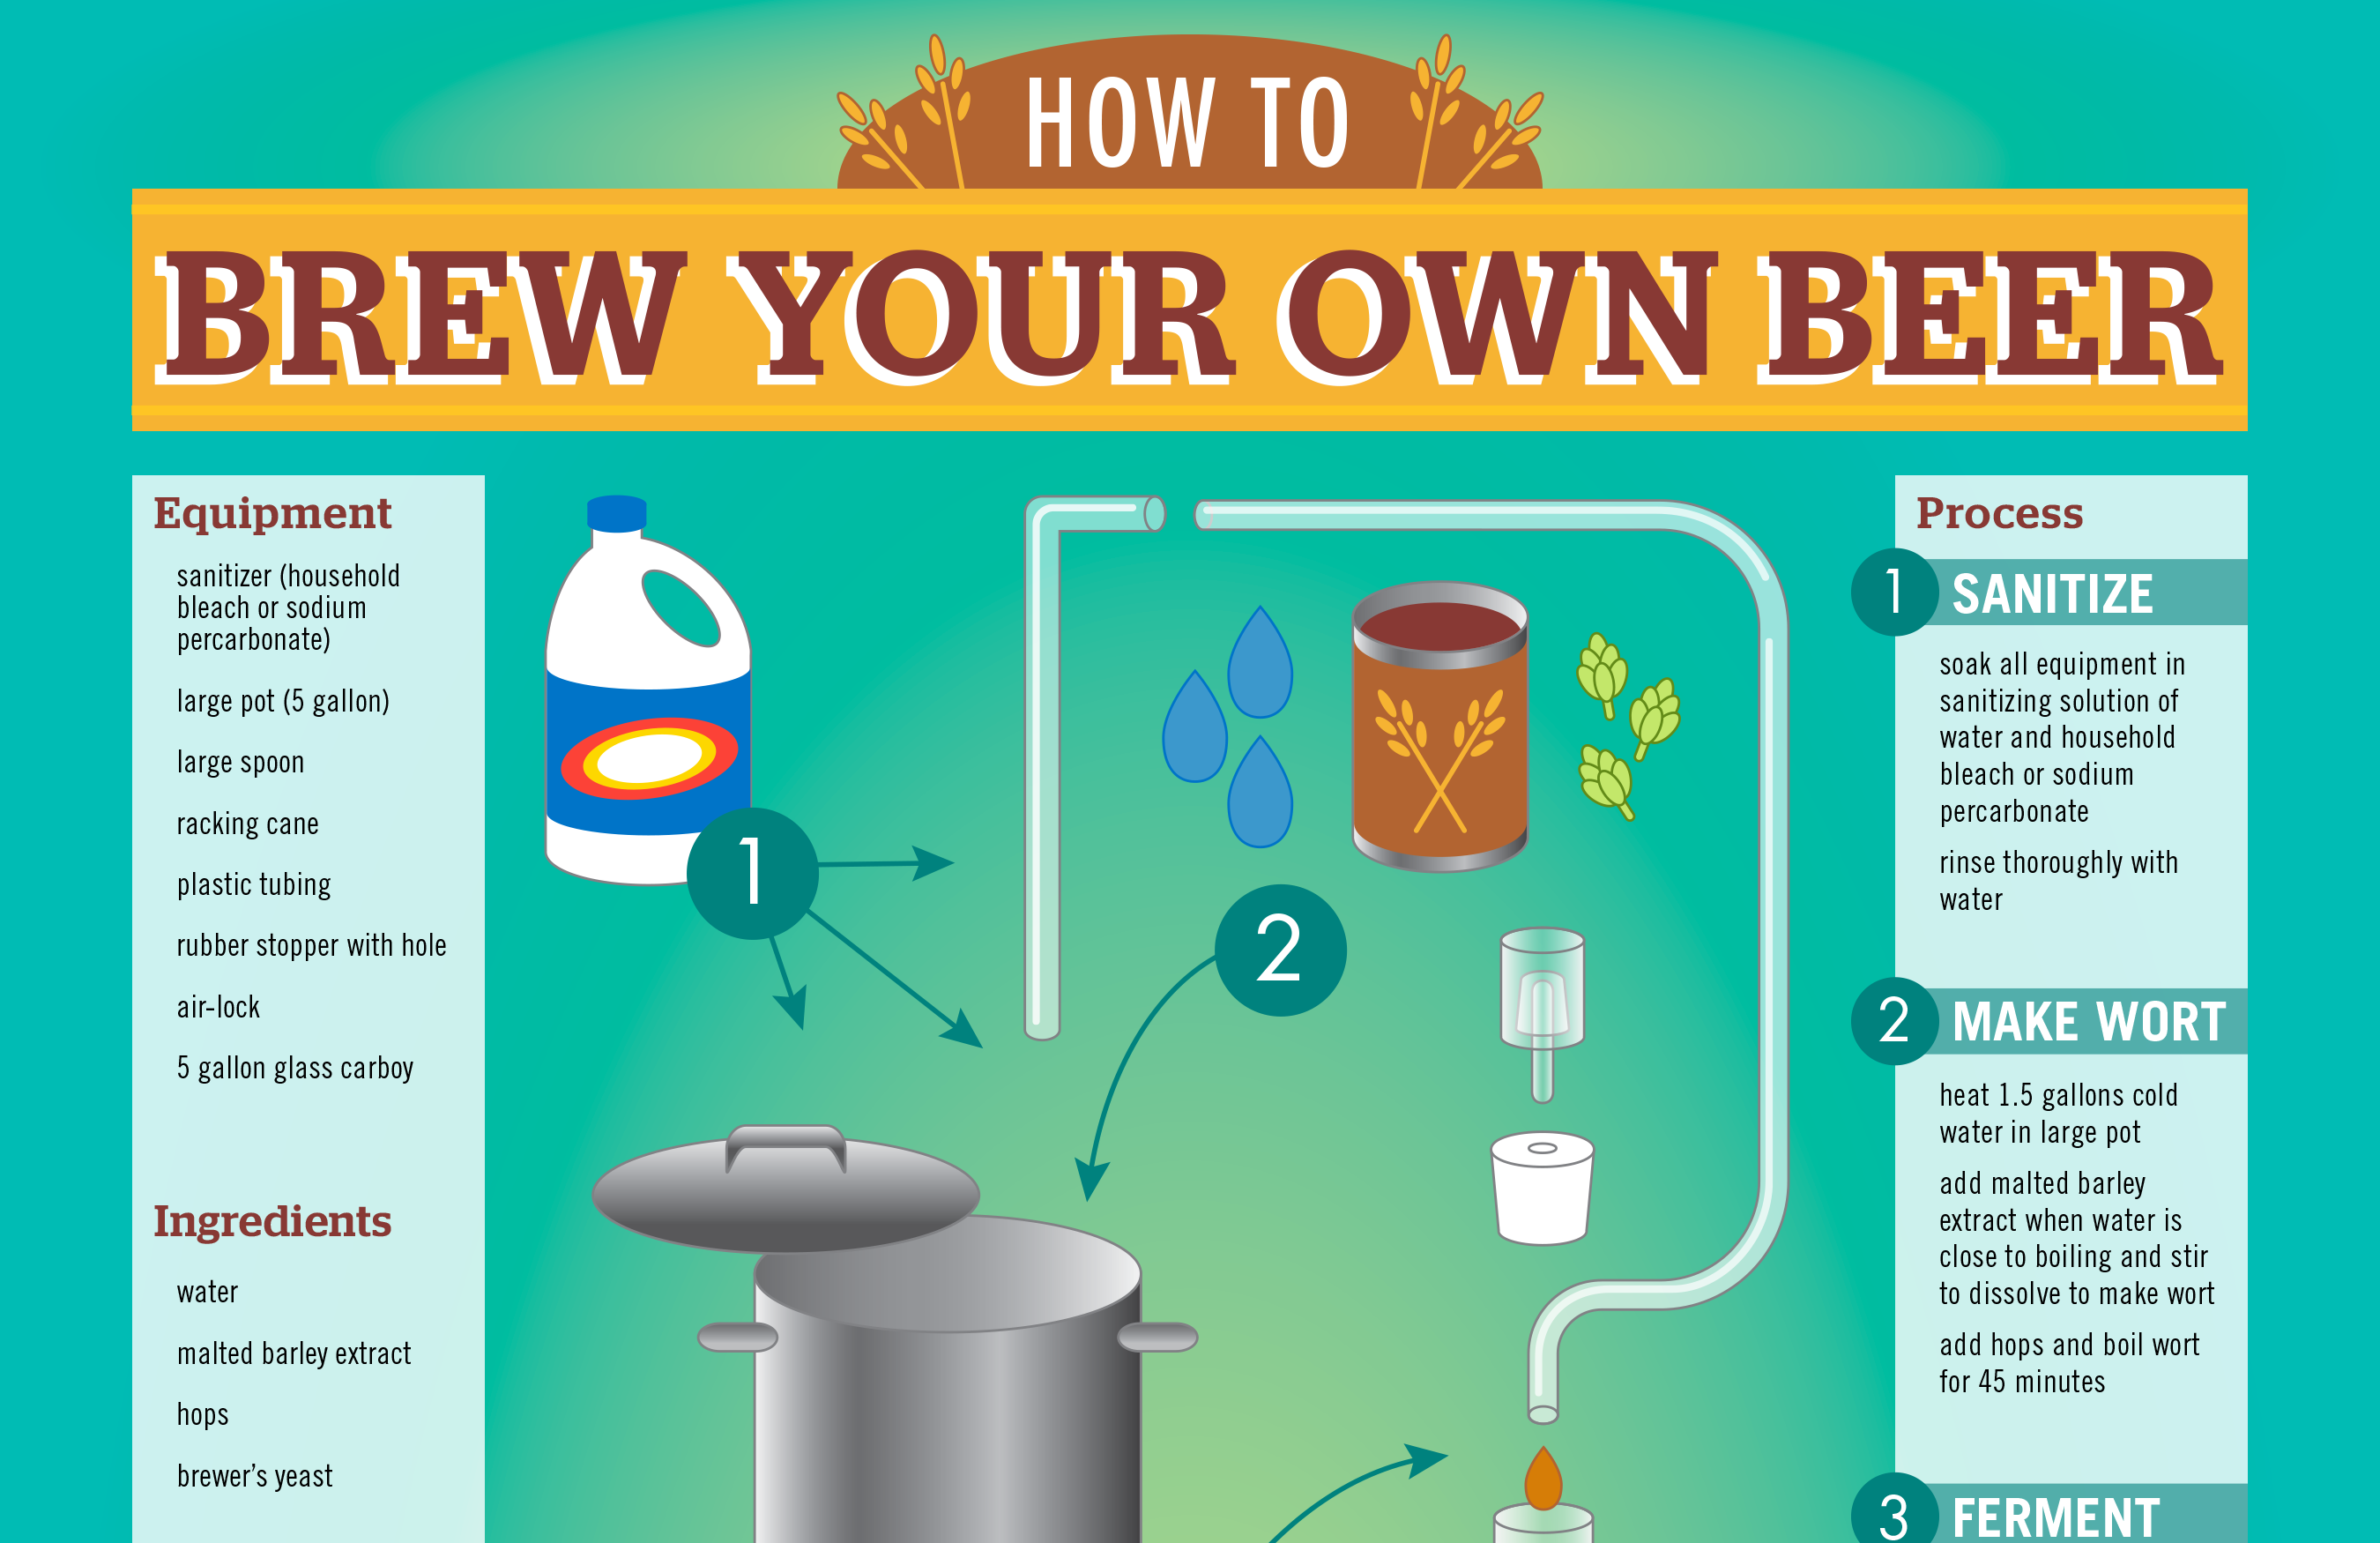
Beer I’ve made a few batches of homebrew in my time and I created this graphic to illustrate the beer brewing...