Congress
Below is a project I completed for a course in Information Design at The School of Visual Arts in 2014. Scroll down to read my analysis and see some additional data exploration.
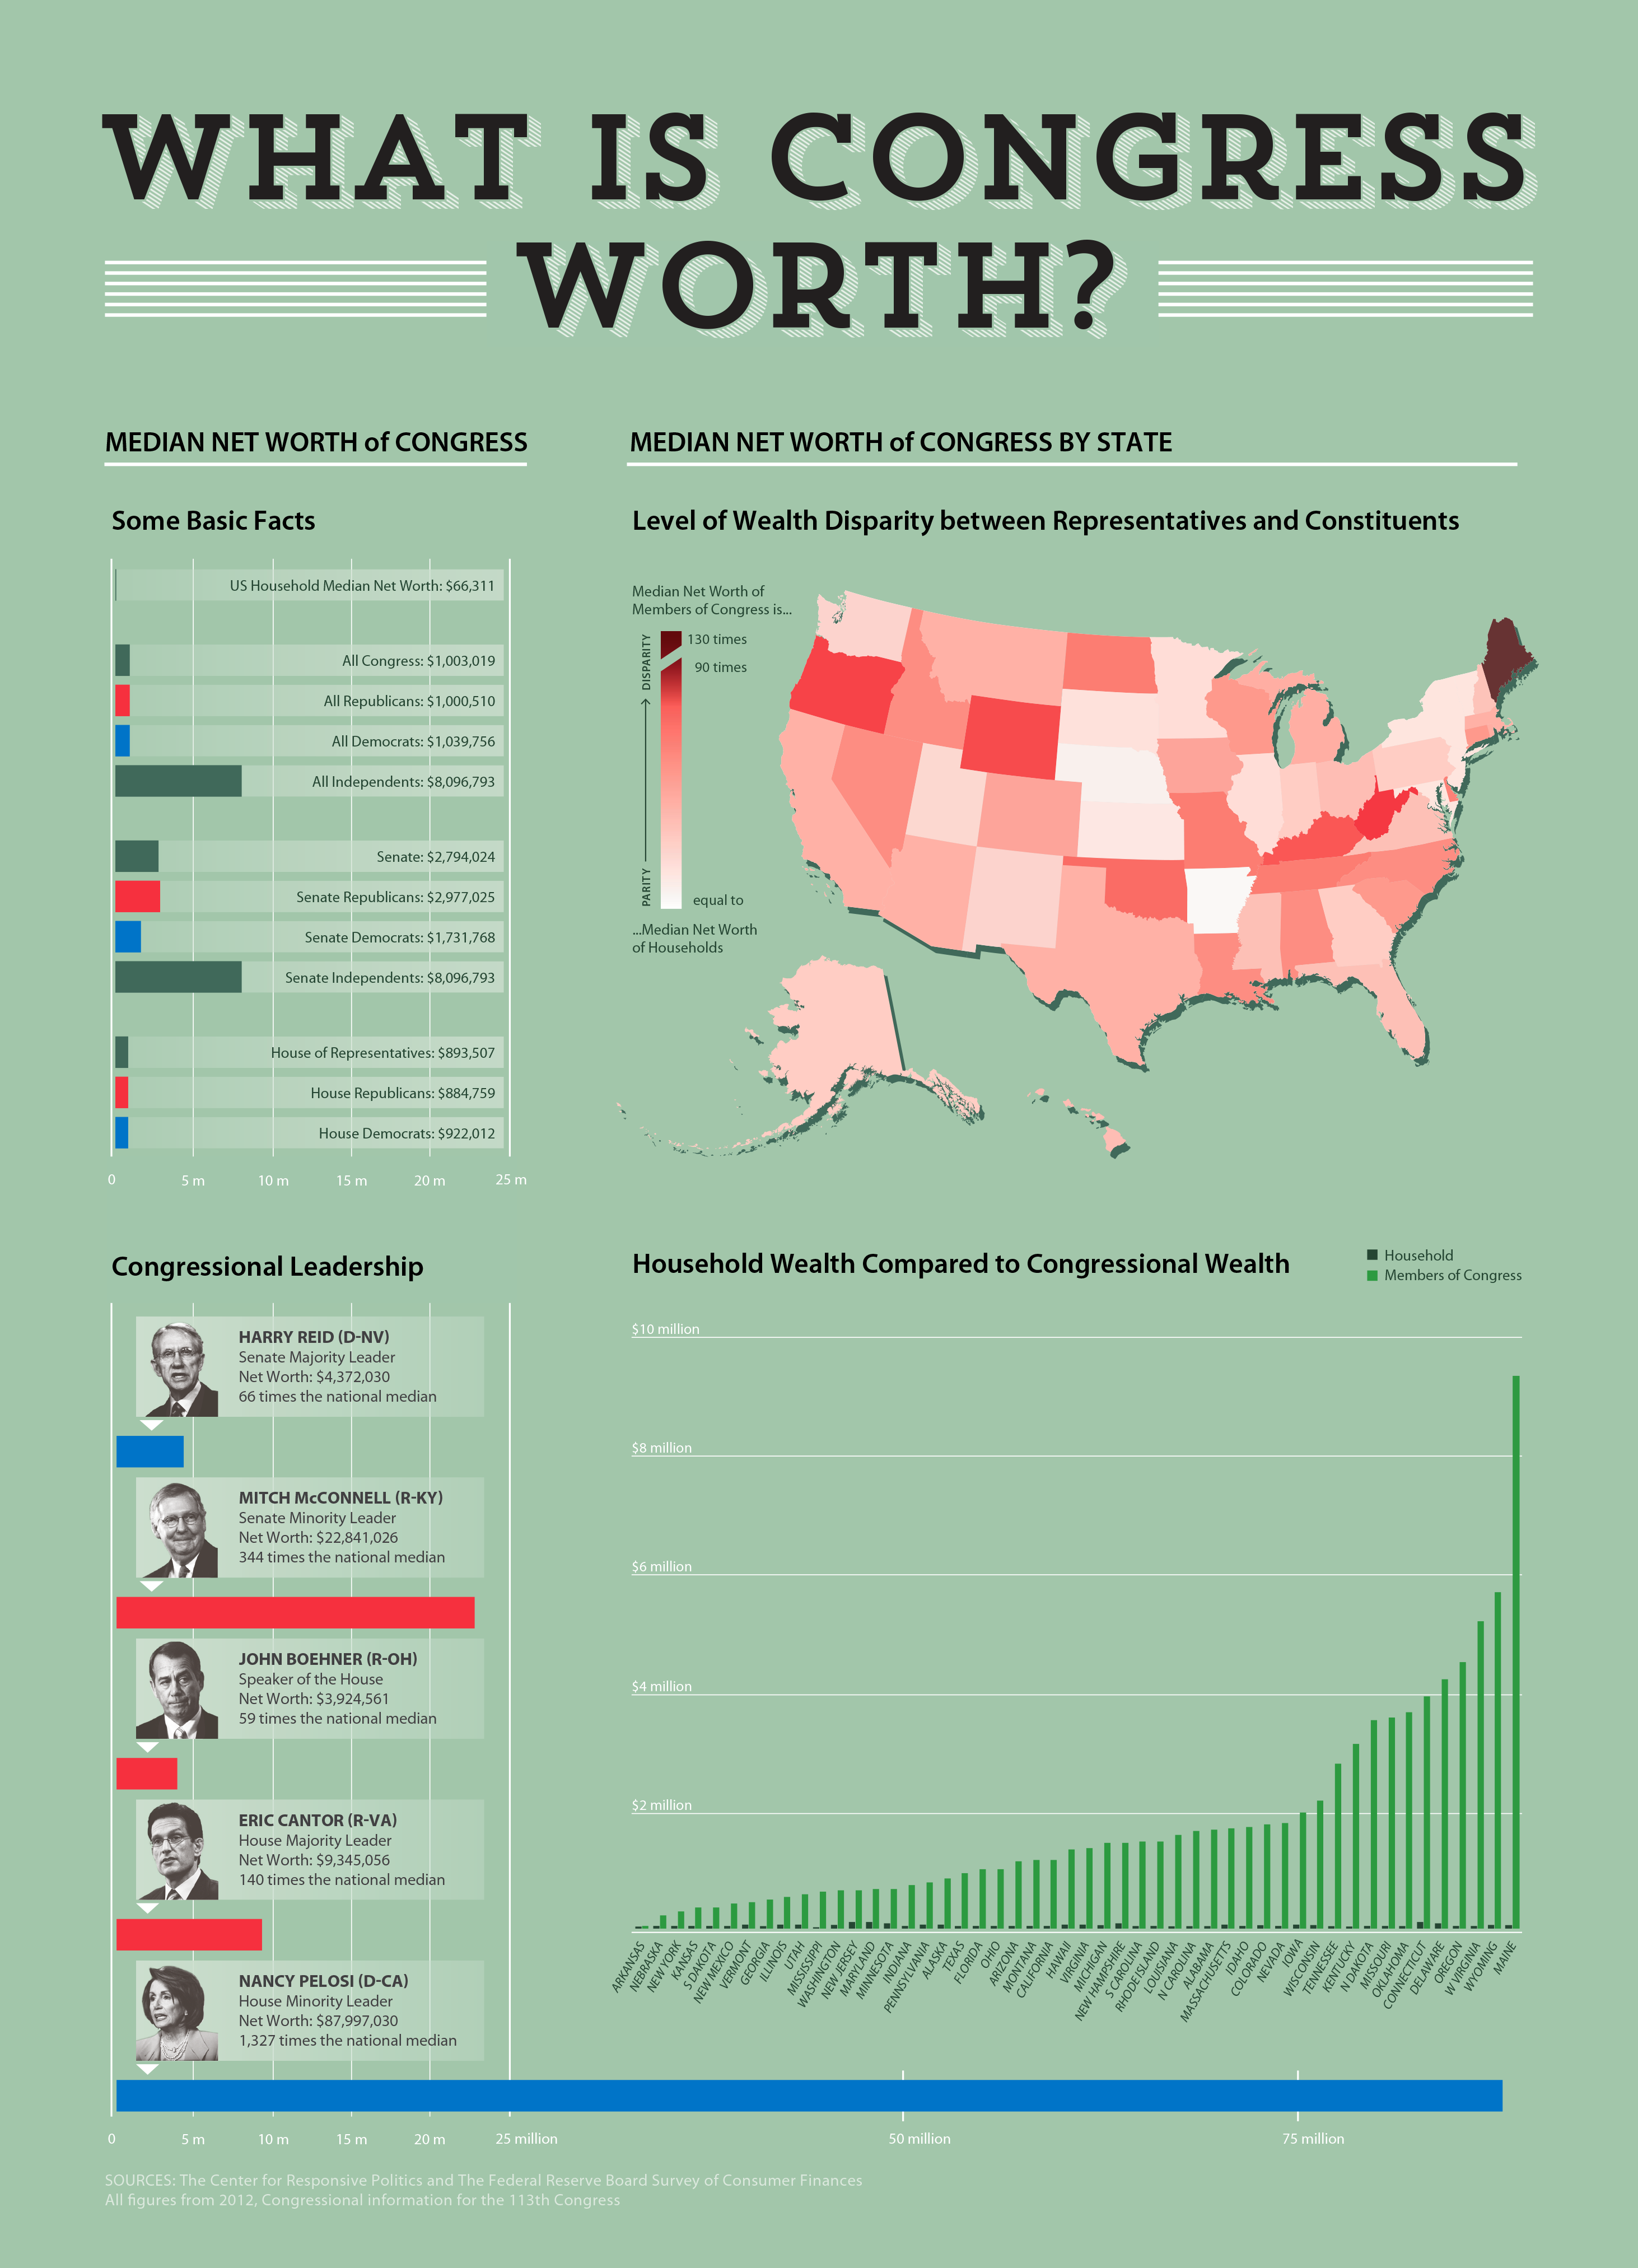
The Center for Responsive Politics (CRP) is a non-profit organization which publishes information on money in politics. In January of 2014, the CRP published data on the net worth of Congress members for 2012 which garnered considerable media attention upon its release. For the first time, the average net worth – defined as an individual’s assets minus their outstanding debt – of a Congress member surpassed $1 million. The median US household wealth for the same year was $66,311. I wanted to explore this data and make comparisons between the wealth of federally elected officials and the people they were elected to represent.
This dataset included current and newly elected members of Congress. Federally elected officials are required to file personal financial disclosure forms each year covering the prior calendar year and these reports are released to the public 30 days later. Newly elected members of Congress were required to file financial reports while they were candidates in 2012. It was from these filings that the CRP gathered the data. To make comparisons to household wealth, I scraped net worth data from an ArcGIS map which cites the Federal Reserve Board Survey of Consumer Finances as its’ source.
I made the decision to examine the data from one specific meeting of Congress, the 113th Congress, which is members holding office from January 3, 2013 to January 3, 2015. I deleted anyone from the data who didn’t fit this criteria, including those voted out of office in the 2012 election, as well as those who died or were appointed to other positions prior to January 3, 2013. If media outlets published figures which differ from mine using this same dataset, I suspect that they did not examine their data in the same fashion.
Overall, Republicans and Democrats are fairly similar, while the median for Independents is much higher. We have a very small sample size of Independents, only two – Senator Bernie Sanders of Vermont worth $460,506, and Senator Angus King of Maine worth $15.7 million – giving us a median of just over $8 million for Independents. Senators tend to have a higher net worth than Representatives, and (aside from the two Independents) Republican Senators have the most wealth. The tiny sliver at the top of the graph represents US household wealth, barely visible when plotted at this scale.
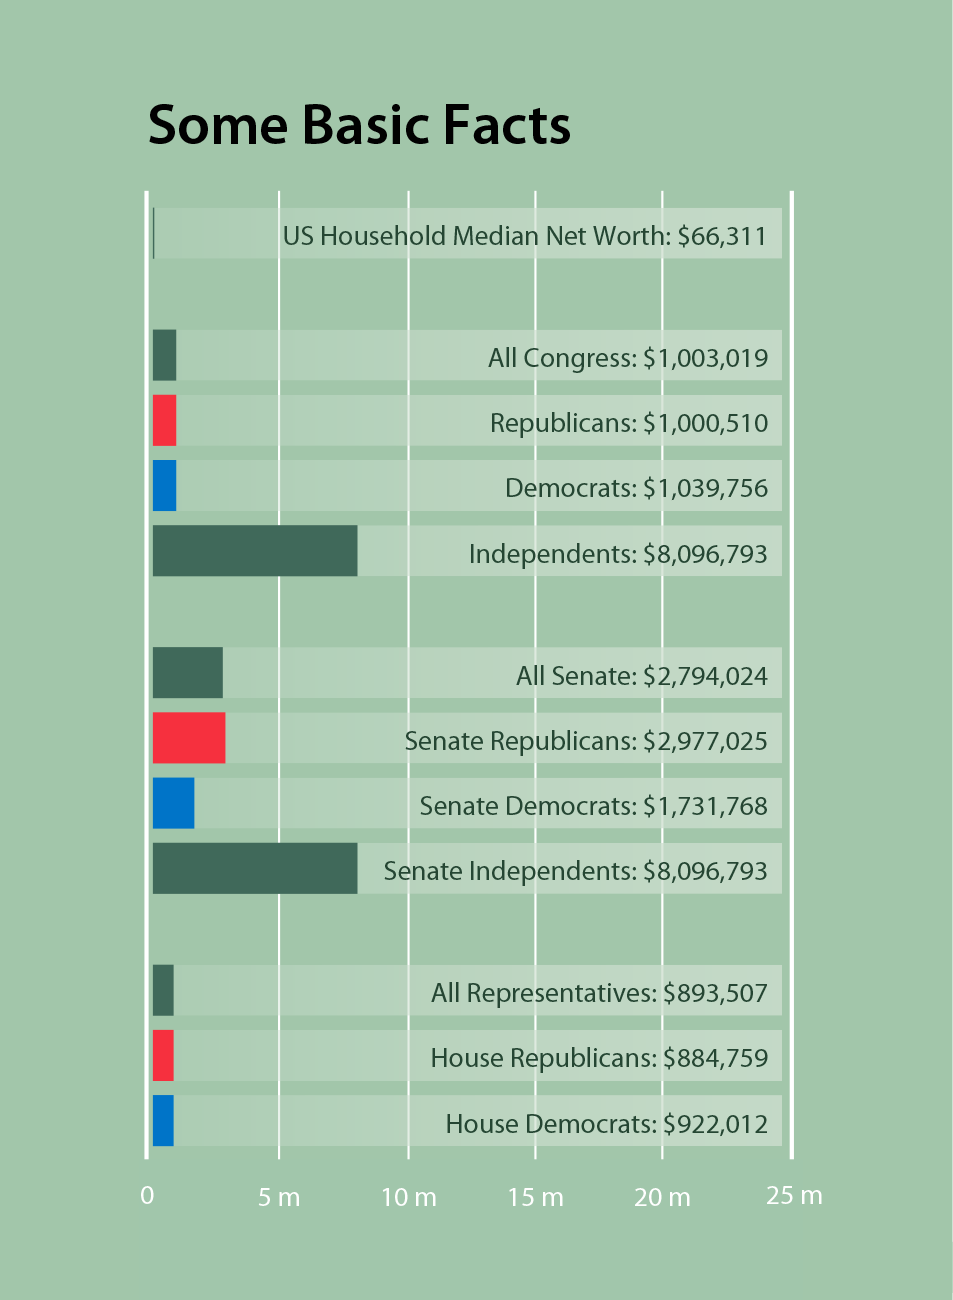
Comparing the net worth of households in each state to the net worth of that state’s representatives, there are very few states in which these numbers are similar. Congress members from Arkansas had the lowest median net worth of any state and are the most similar in wealth to their constituents. In contrast, Congress members from Maine had the highest median, approaching $10 million, vastly greater than their constituents.

The median representative from Maine is worth about 130 times the median Maine household. I wondered if this great disparity was due to a small sample size, Maine having only four representatives in Congress, but Arkansas, with the greatest parity, has a similar number of representatives with only six. Was Angus King, the wealthy Independent, driving up the median net worth of representatives from Maine? Yes, but he is not as wealthy as Maine Representative Chellie Pingree, a Democrat worth over $40 million and the wealthiest representative of that state. Meanwhile in Arkansas, net worth of representatives ranges from the more than $3.5 million of Senator John Boozman, to the $175,000 in debt owned by Representative Rick Crawford.

When looking at the Congressional leadership, all appear wealthier than the median House and Senate membership and are vastly more wealthy than the median household. Nancy Pelosi is the wealthiest of the leadership and, indeed, broke the scale of my graph with a net worth of nearly $88 million, 1,327 times the national household median.
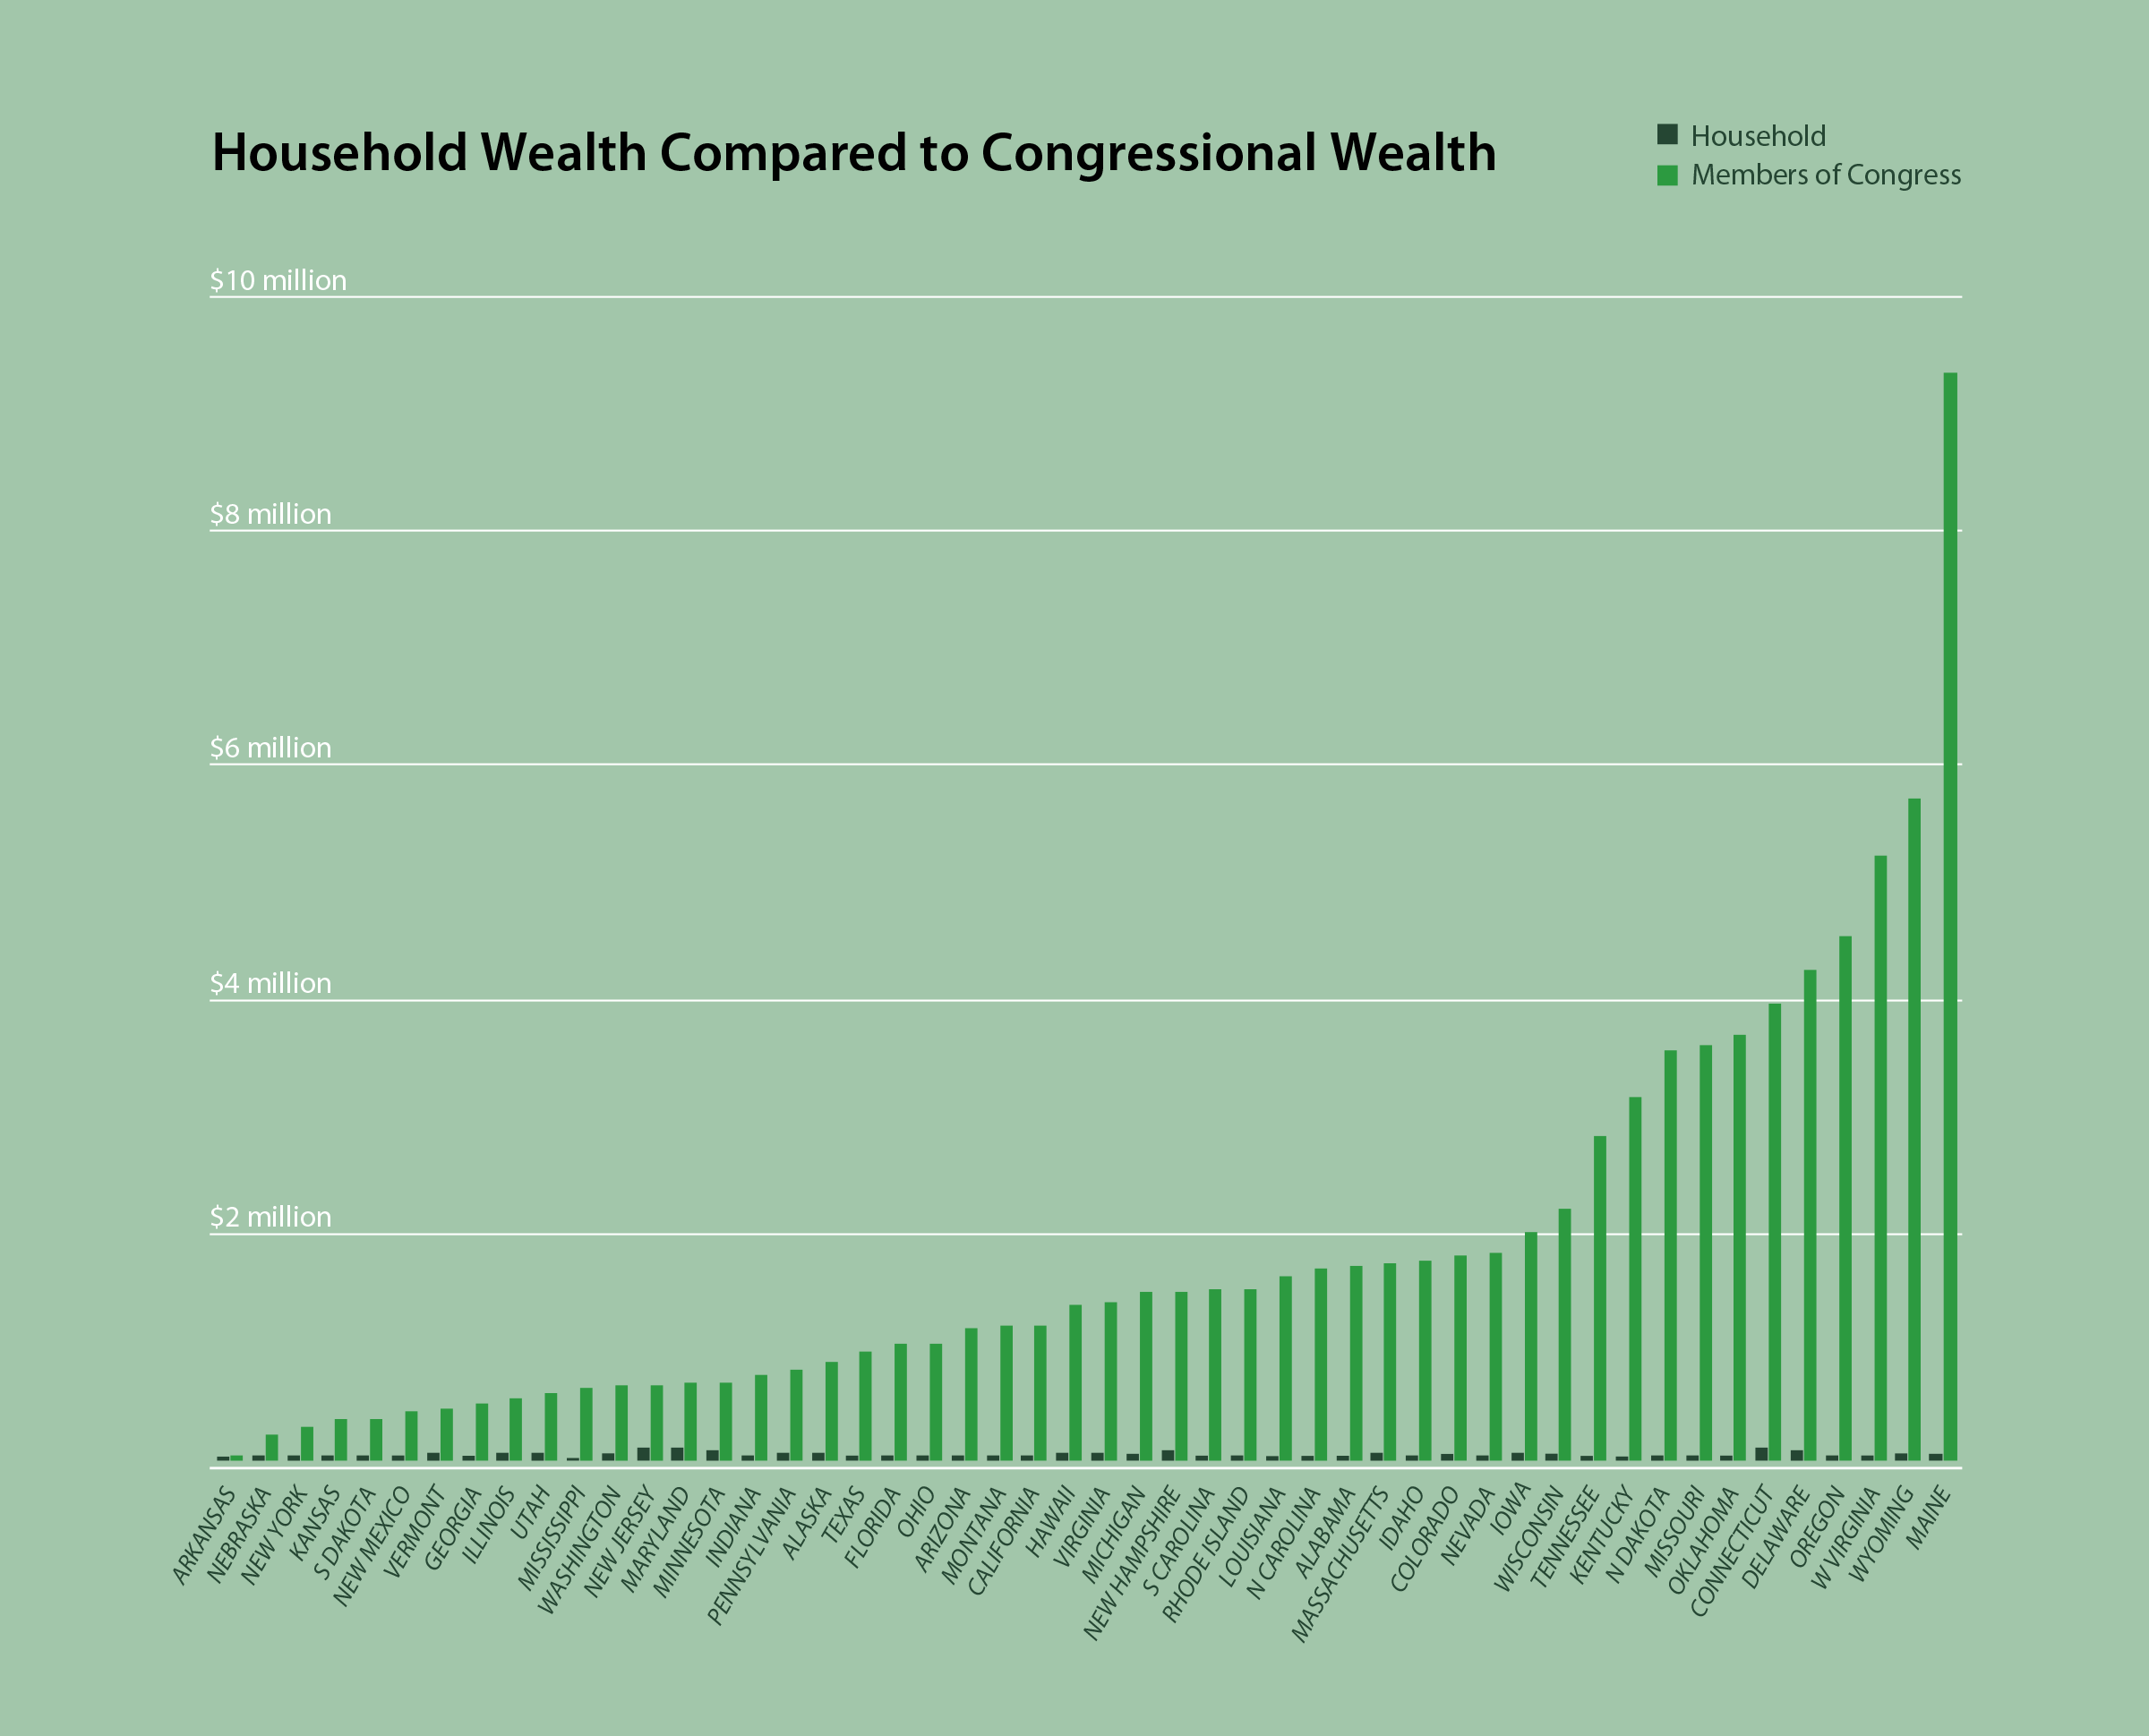
I wondered if there are any relationships between the wealth of representatives and their age or length of time in office. I plotted these variables as a bubble plot with the size of the bubbles corresponding to a Congress members net worth.
Many of the wealthiest members of Congress are more recently elected, having served for less than 12 years. These wealthy Congress members range in age from about 50 to 70 years old. Is vast wealth becoming the cost of entry to getting elected to federal office? I think it is quite possible but cannot be determined by this dataset alone. To answer this question, we could compare this data to similar historical data. Since I could not draw any definitive conclusions based on this plot, it didn’t make it into my final graphic.
As a final step, I incorporated all of my charts (excluding the bubble plot) into a single poster graphic, as seen at the beginning.
I was interested in this data, as I’m sure many people were, because I wondered: how much disparity exists between members of Congress and their constituents? And with such vast wealth compared to those constituents, how much can members of Congress relate to the needs and challenges of the people they represent? For this second question, I still don’t have an answer.