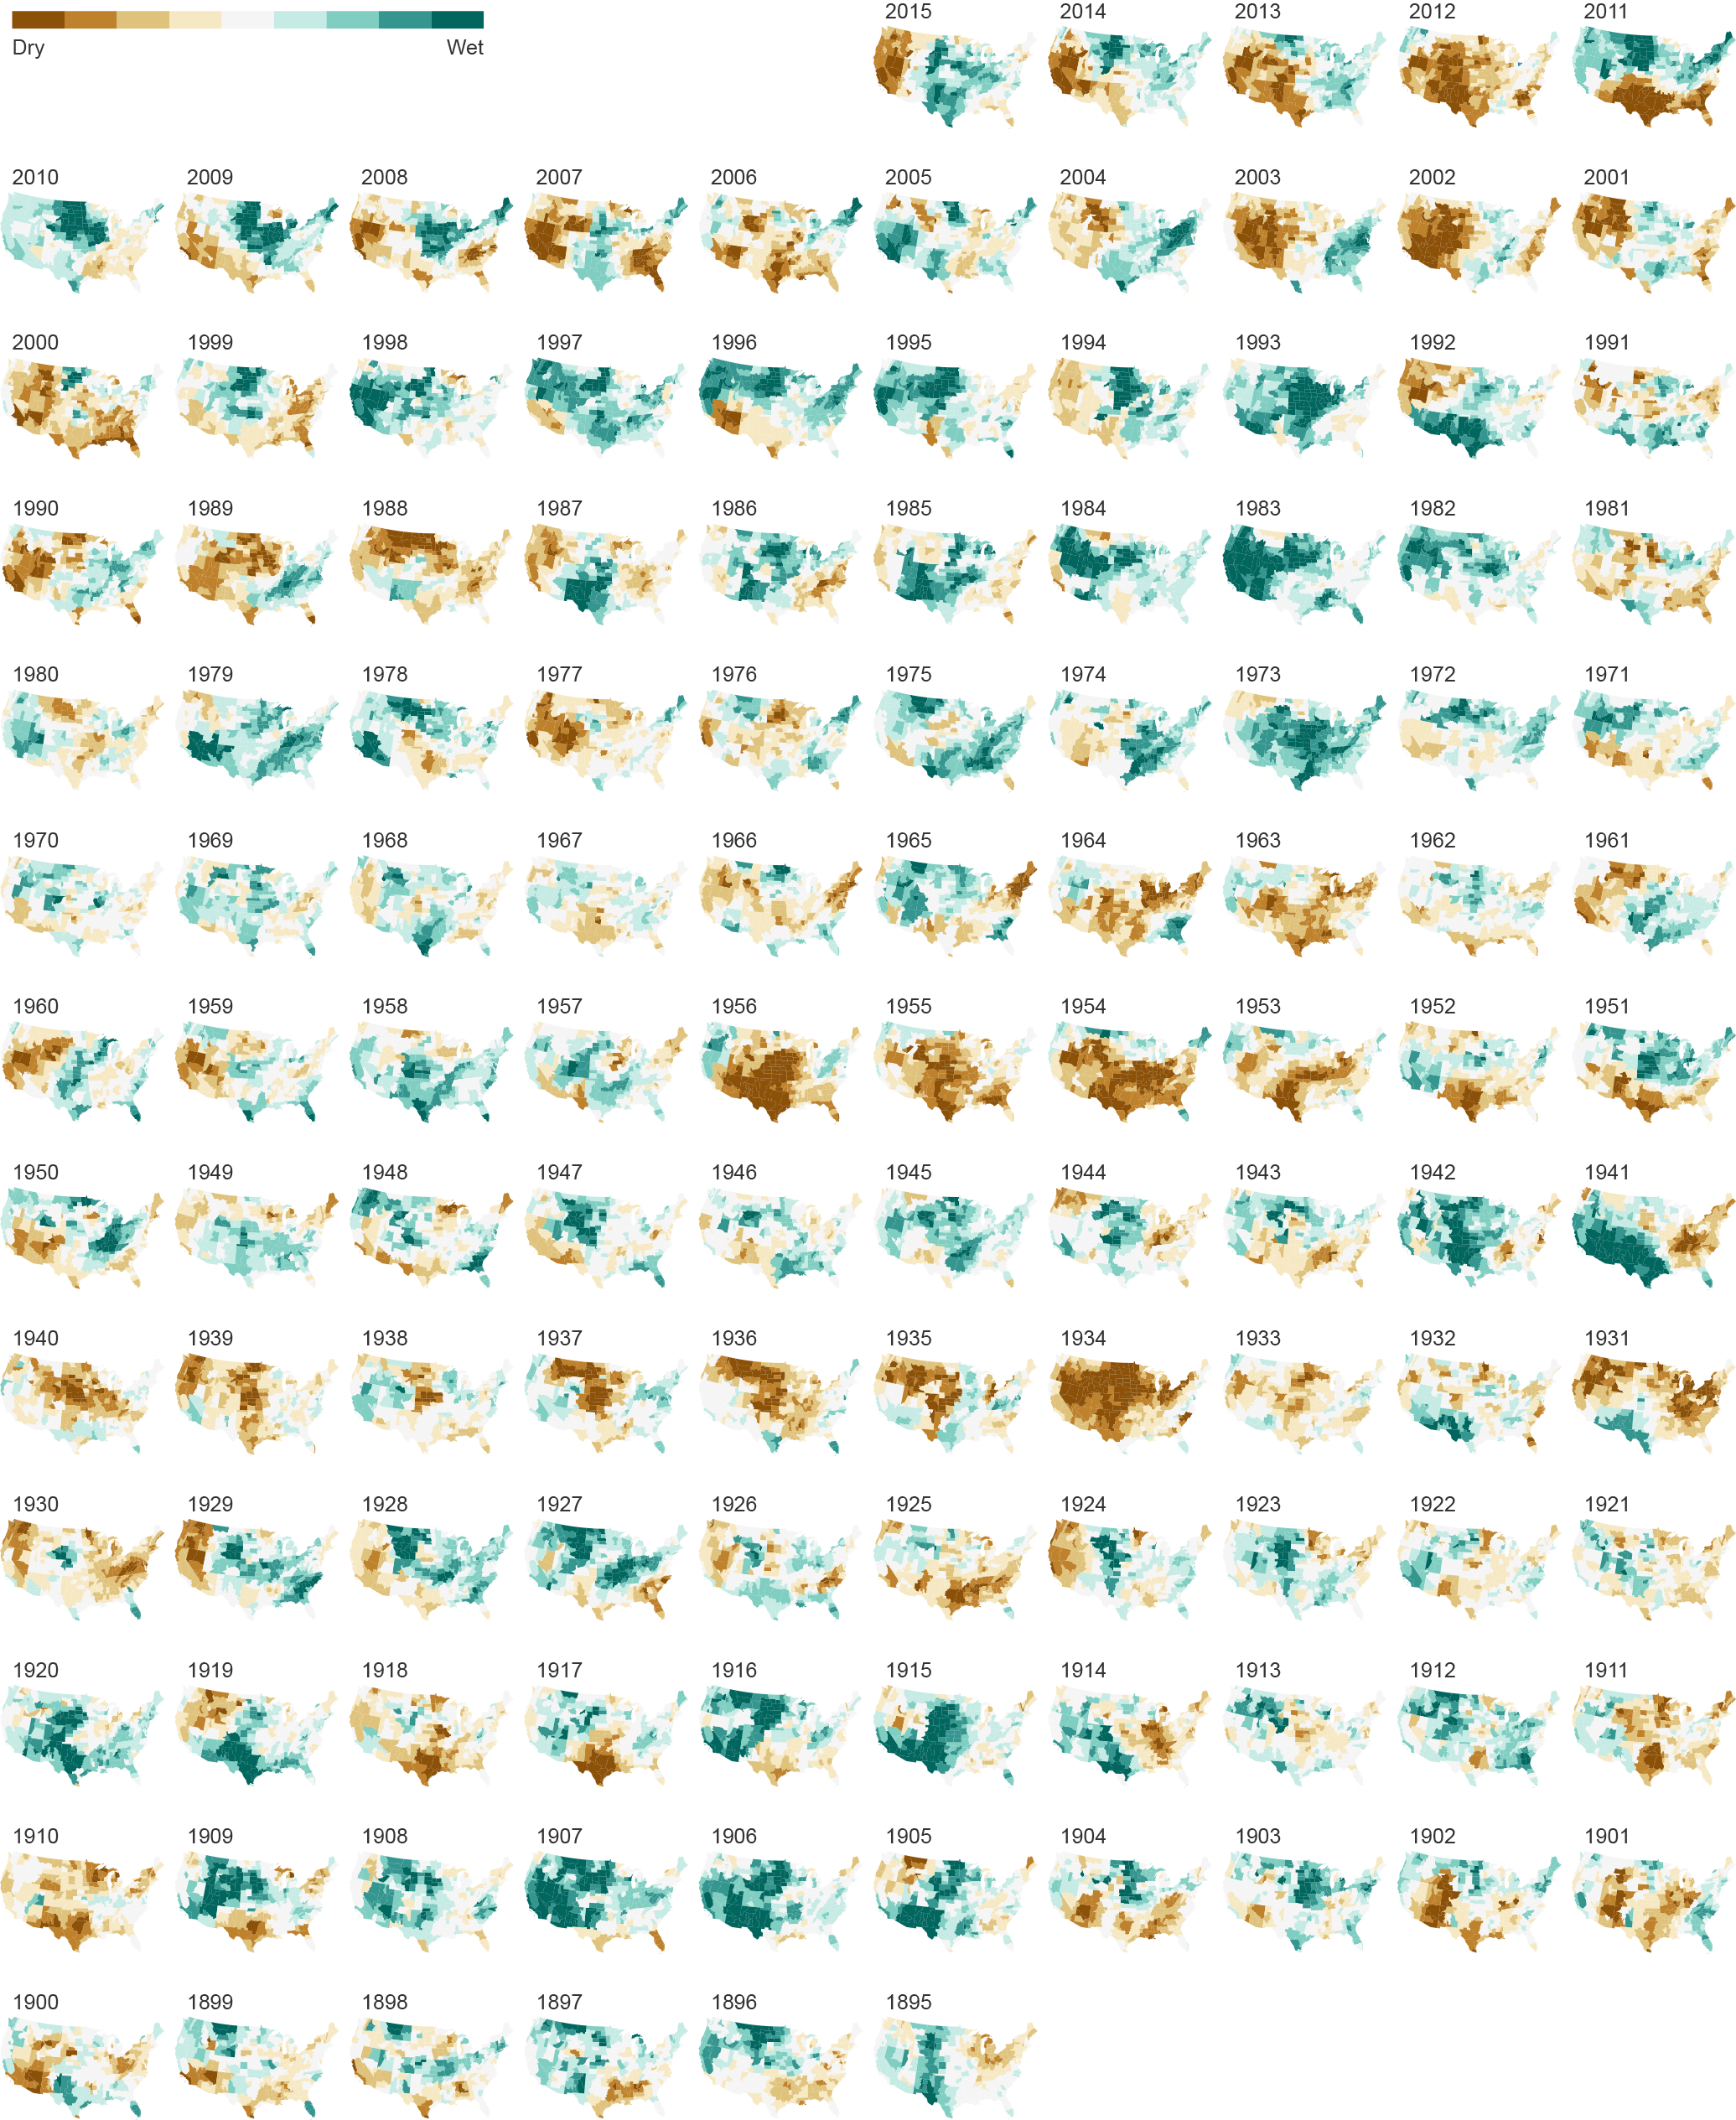
Tiny Drought Maps
Using the Palmer Drought Severity Index, a measure of dryness / wetness, I mapped the yearly average drought level in different climate divisions across the United States from 1895 to 2015. In recent years, drought in the west and southwest stands out, though, the most severe year of drought in this time period was 1934 during the Great Depression.
The code for creating these maps can be found here.
Source: NOAA